Ector County Analytics – Poverty and Potential Improvements to Serve Economically Disadvantaged Populations
Category: No Category
Written By: Julio Carrillo
Date: April 30, 2020

Julio Carrillo is a Senior Planner & Manager with Parkhill’s Landscape Architecture & Planning Sector. With over 15 years of experience, he has managed and directed projects ranging from architecture and green building consulting to urban design and community planning. Through his diverse knowledge of residential, multifamily, corporate office, educational, institutional, municipal, and neighborhood design, Julio, builds communities, not only projects.
Parkhill is proud to explore, in partnership with Ector County ISD, innovative ways to locate WIFI Towers within the limits of the school district. The methodology shown in this article is directly related to a reaction to current needs for Ector County: increase adaptability for online learning due to COVID-19 evolution in the State of Texas. While Ector County’s Director Kellie Wilks, Ed.D, has already informed a serving need for the county, this specific circumstance of the evolution of the pandemic has made it more evident that Economically Disadvantage Populations have a higher burden to access services and technology.
DISTRIBUTION AND CONCENTRATION OF ECODIS STUDENTS IN ECTOR COUNTY
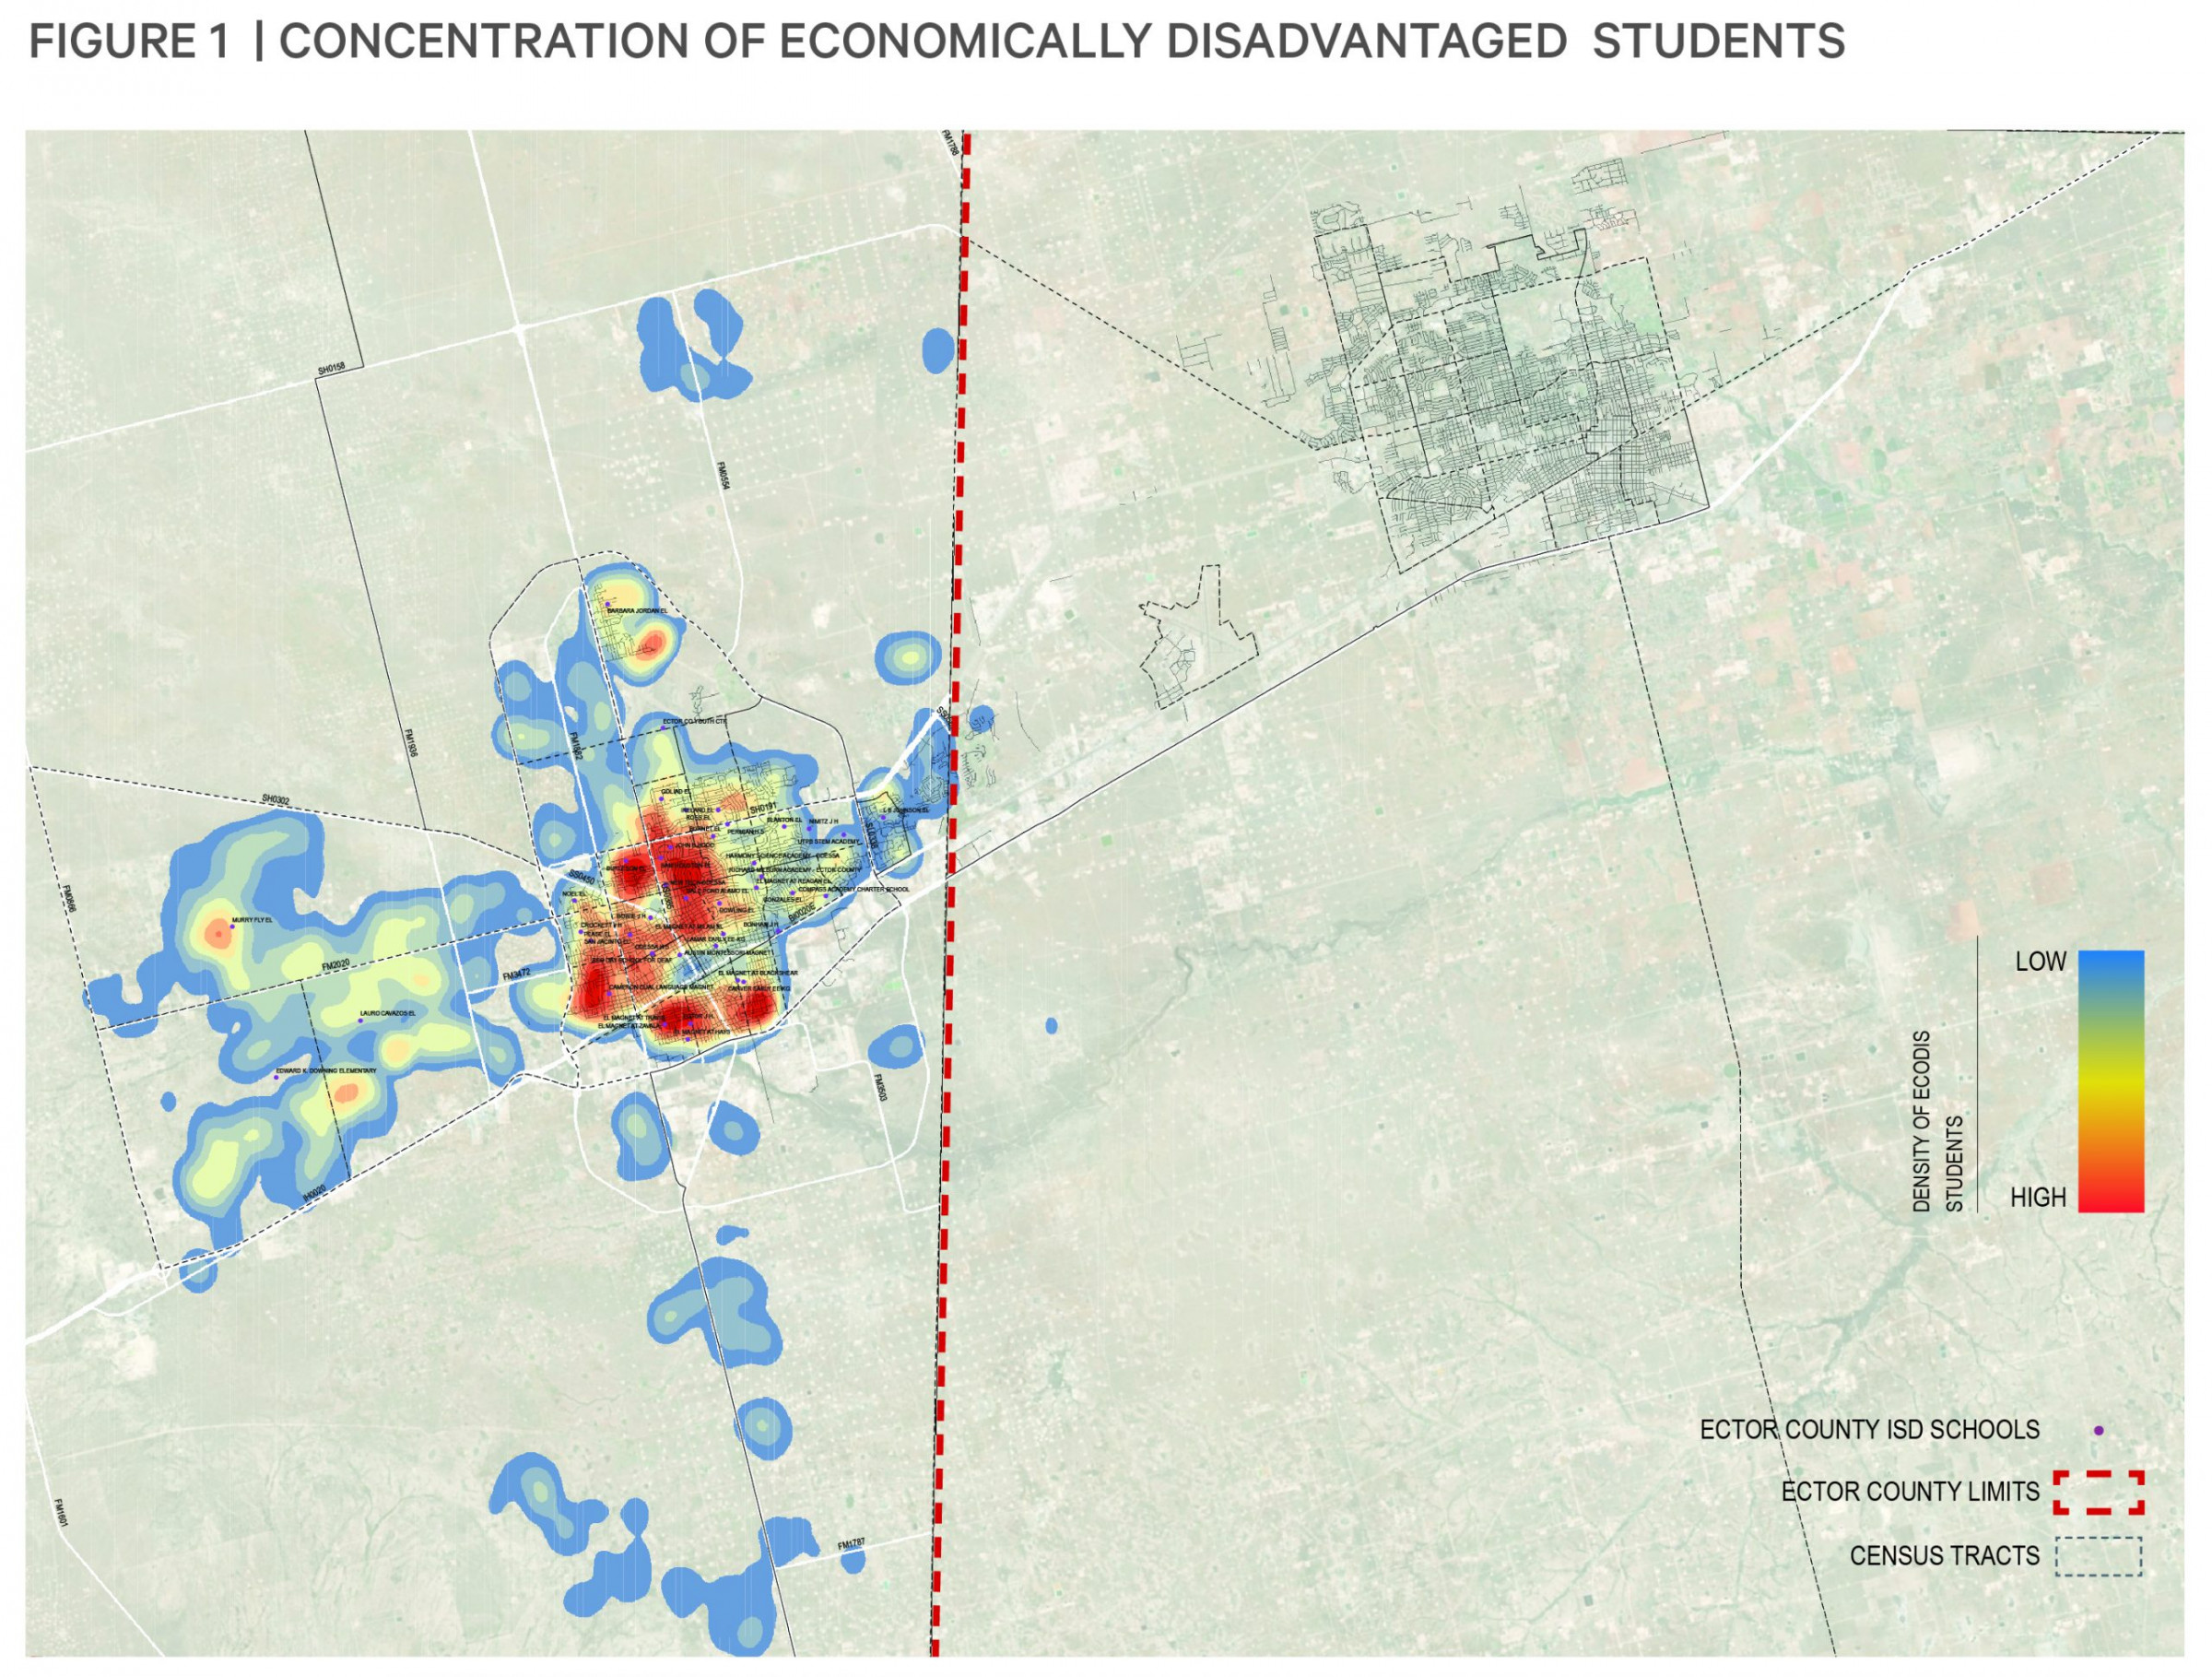
The study highlights in its first step, the concentration of Economically Disadvantaged (ECODIS) students that are currently enrolled in ECISD. Figure 1 shows this distribution/concentration.
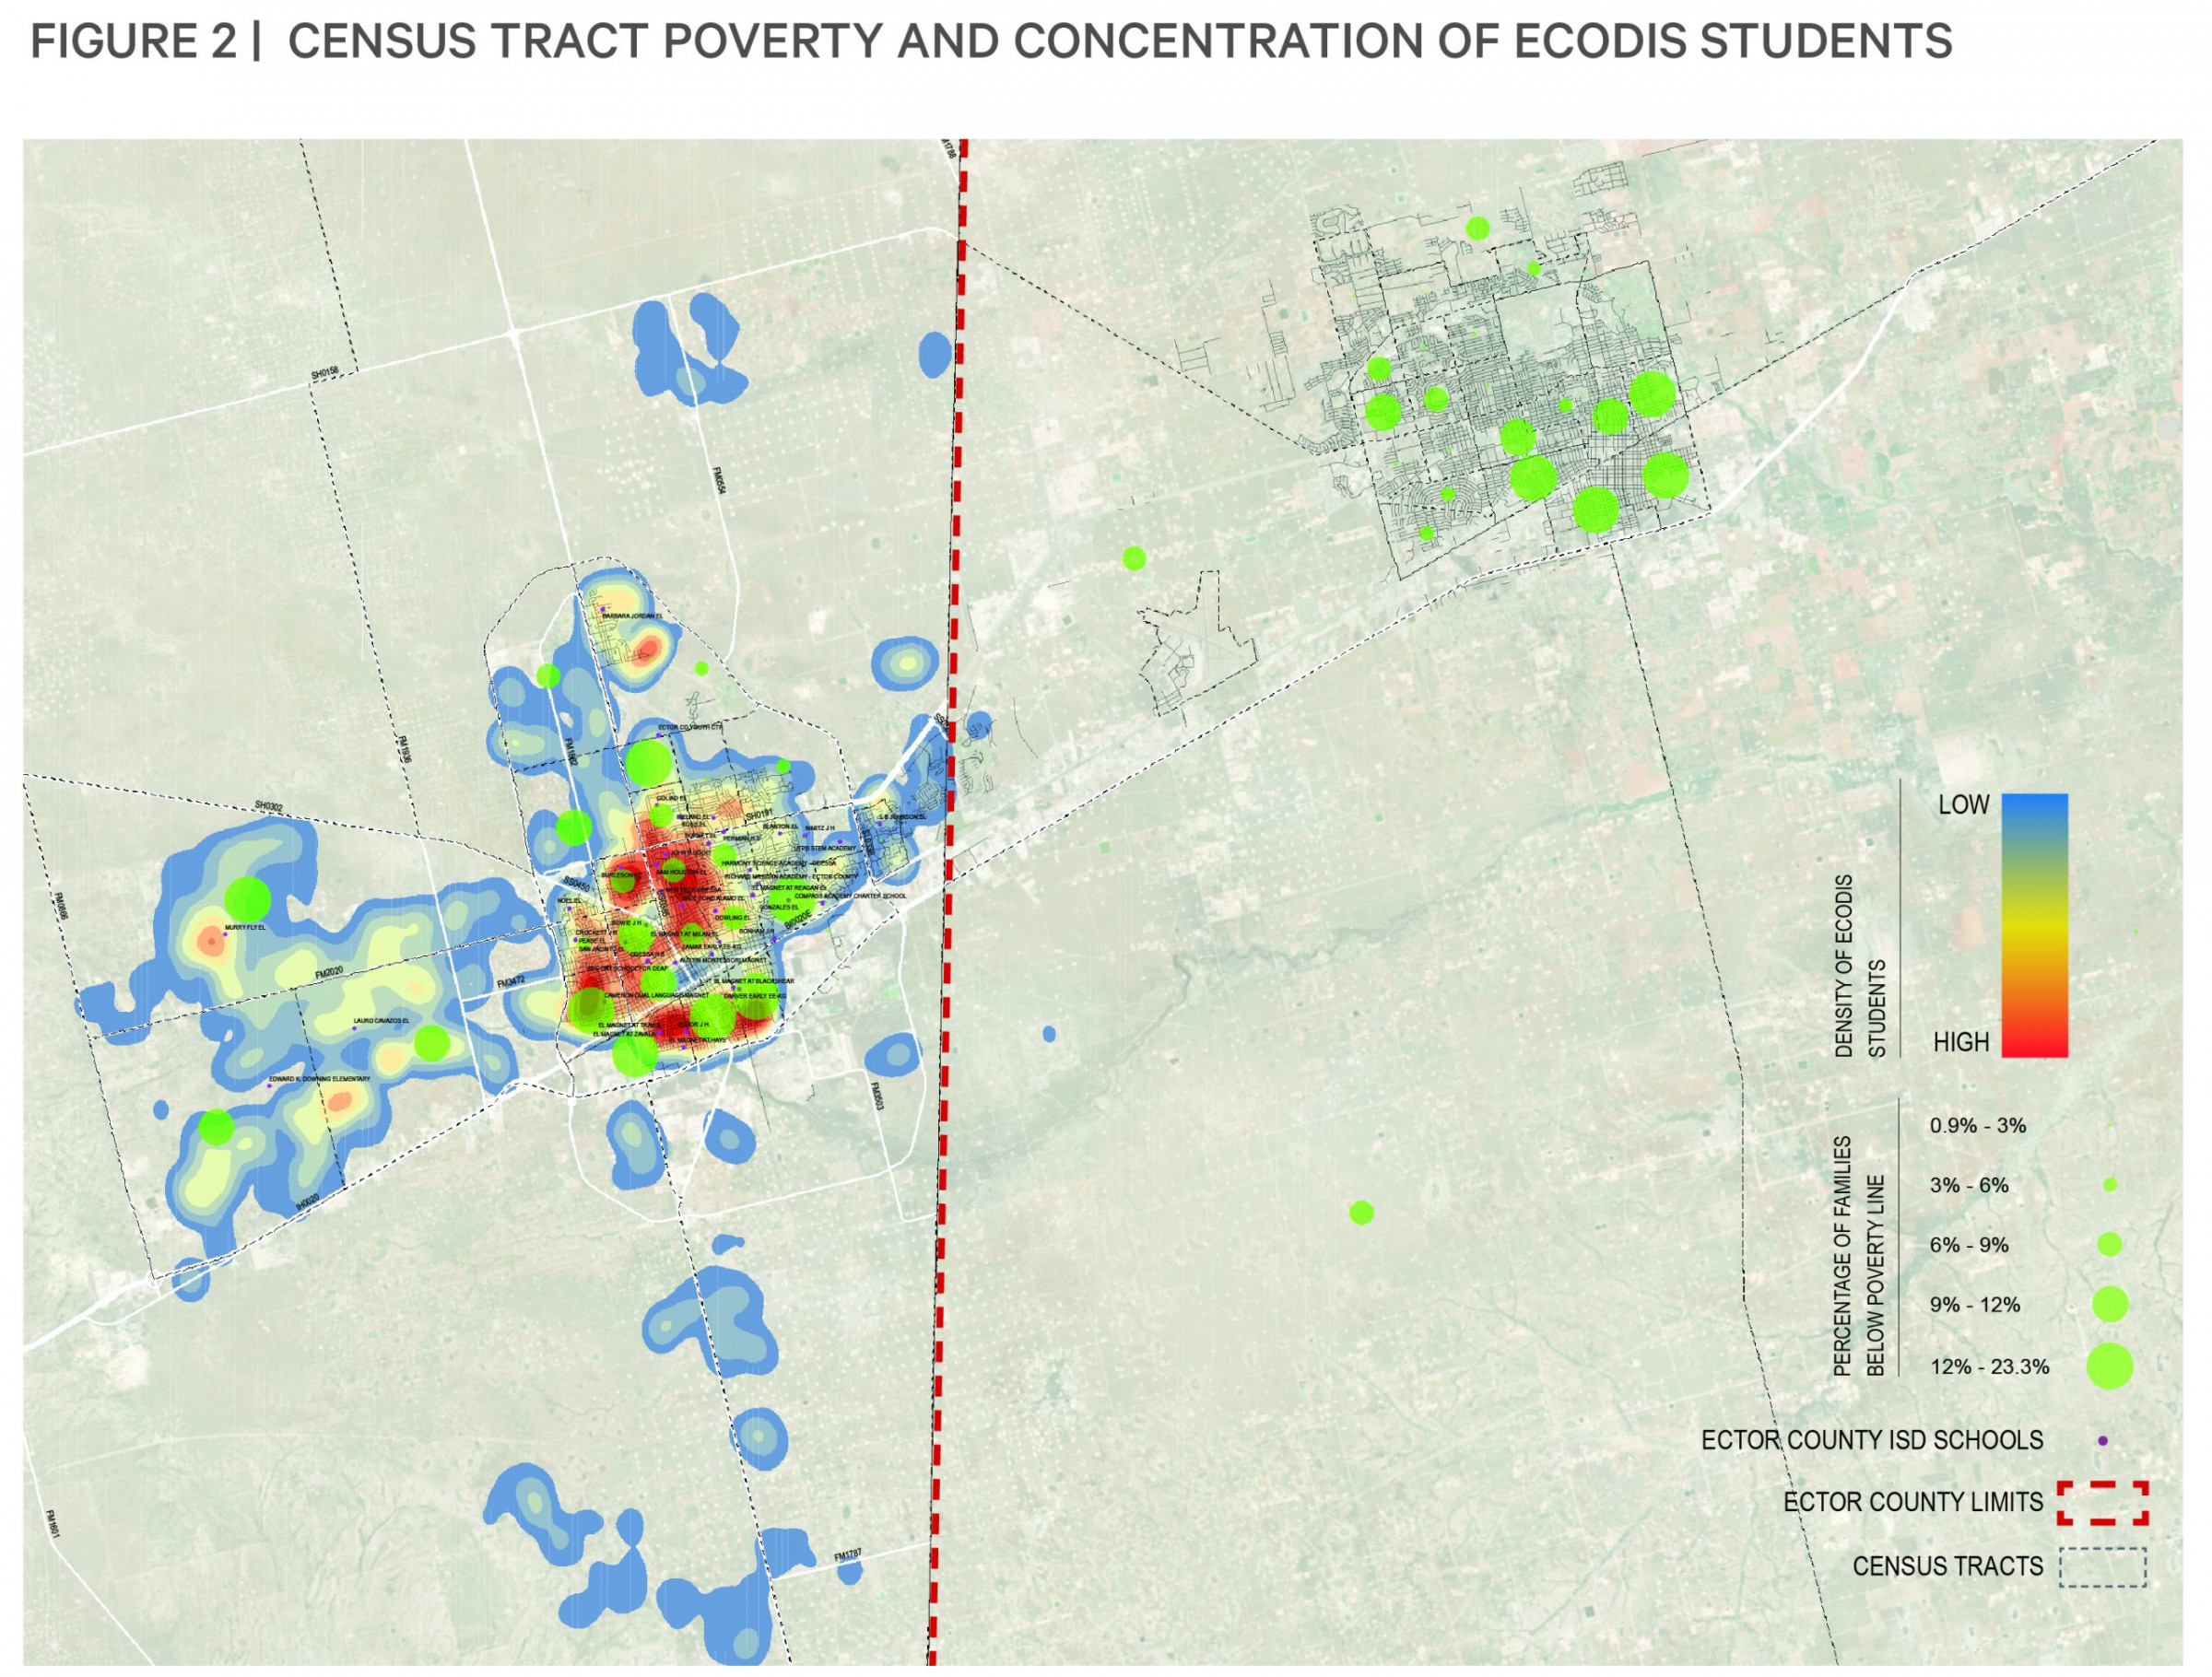 The distribution of the ECODIS students is not necessarily directly correlated with the number of families under falling under the poverty line according to census data. This might be a result of families or households that do not have kids attending schools or kids attending schools outside the School District jurisdiction. Census data is showcased in Figure 2 with proportional circles in green.
The takeaway from this analysis is that Census Tract Data does not necessarily directly correlate to the geographic distribution of ECODIS students. The Parkhill Analytics Team points out that Census Tract Data is always subdivided into blocks with statistically comparable population amounts. Therefore, some census tracts cover a larger amount of area versus other sections with higher population densities (smaller Census Tracts).
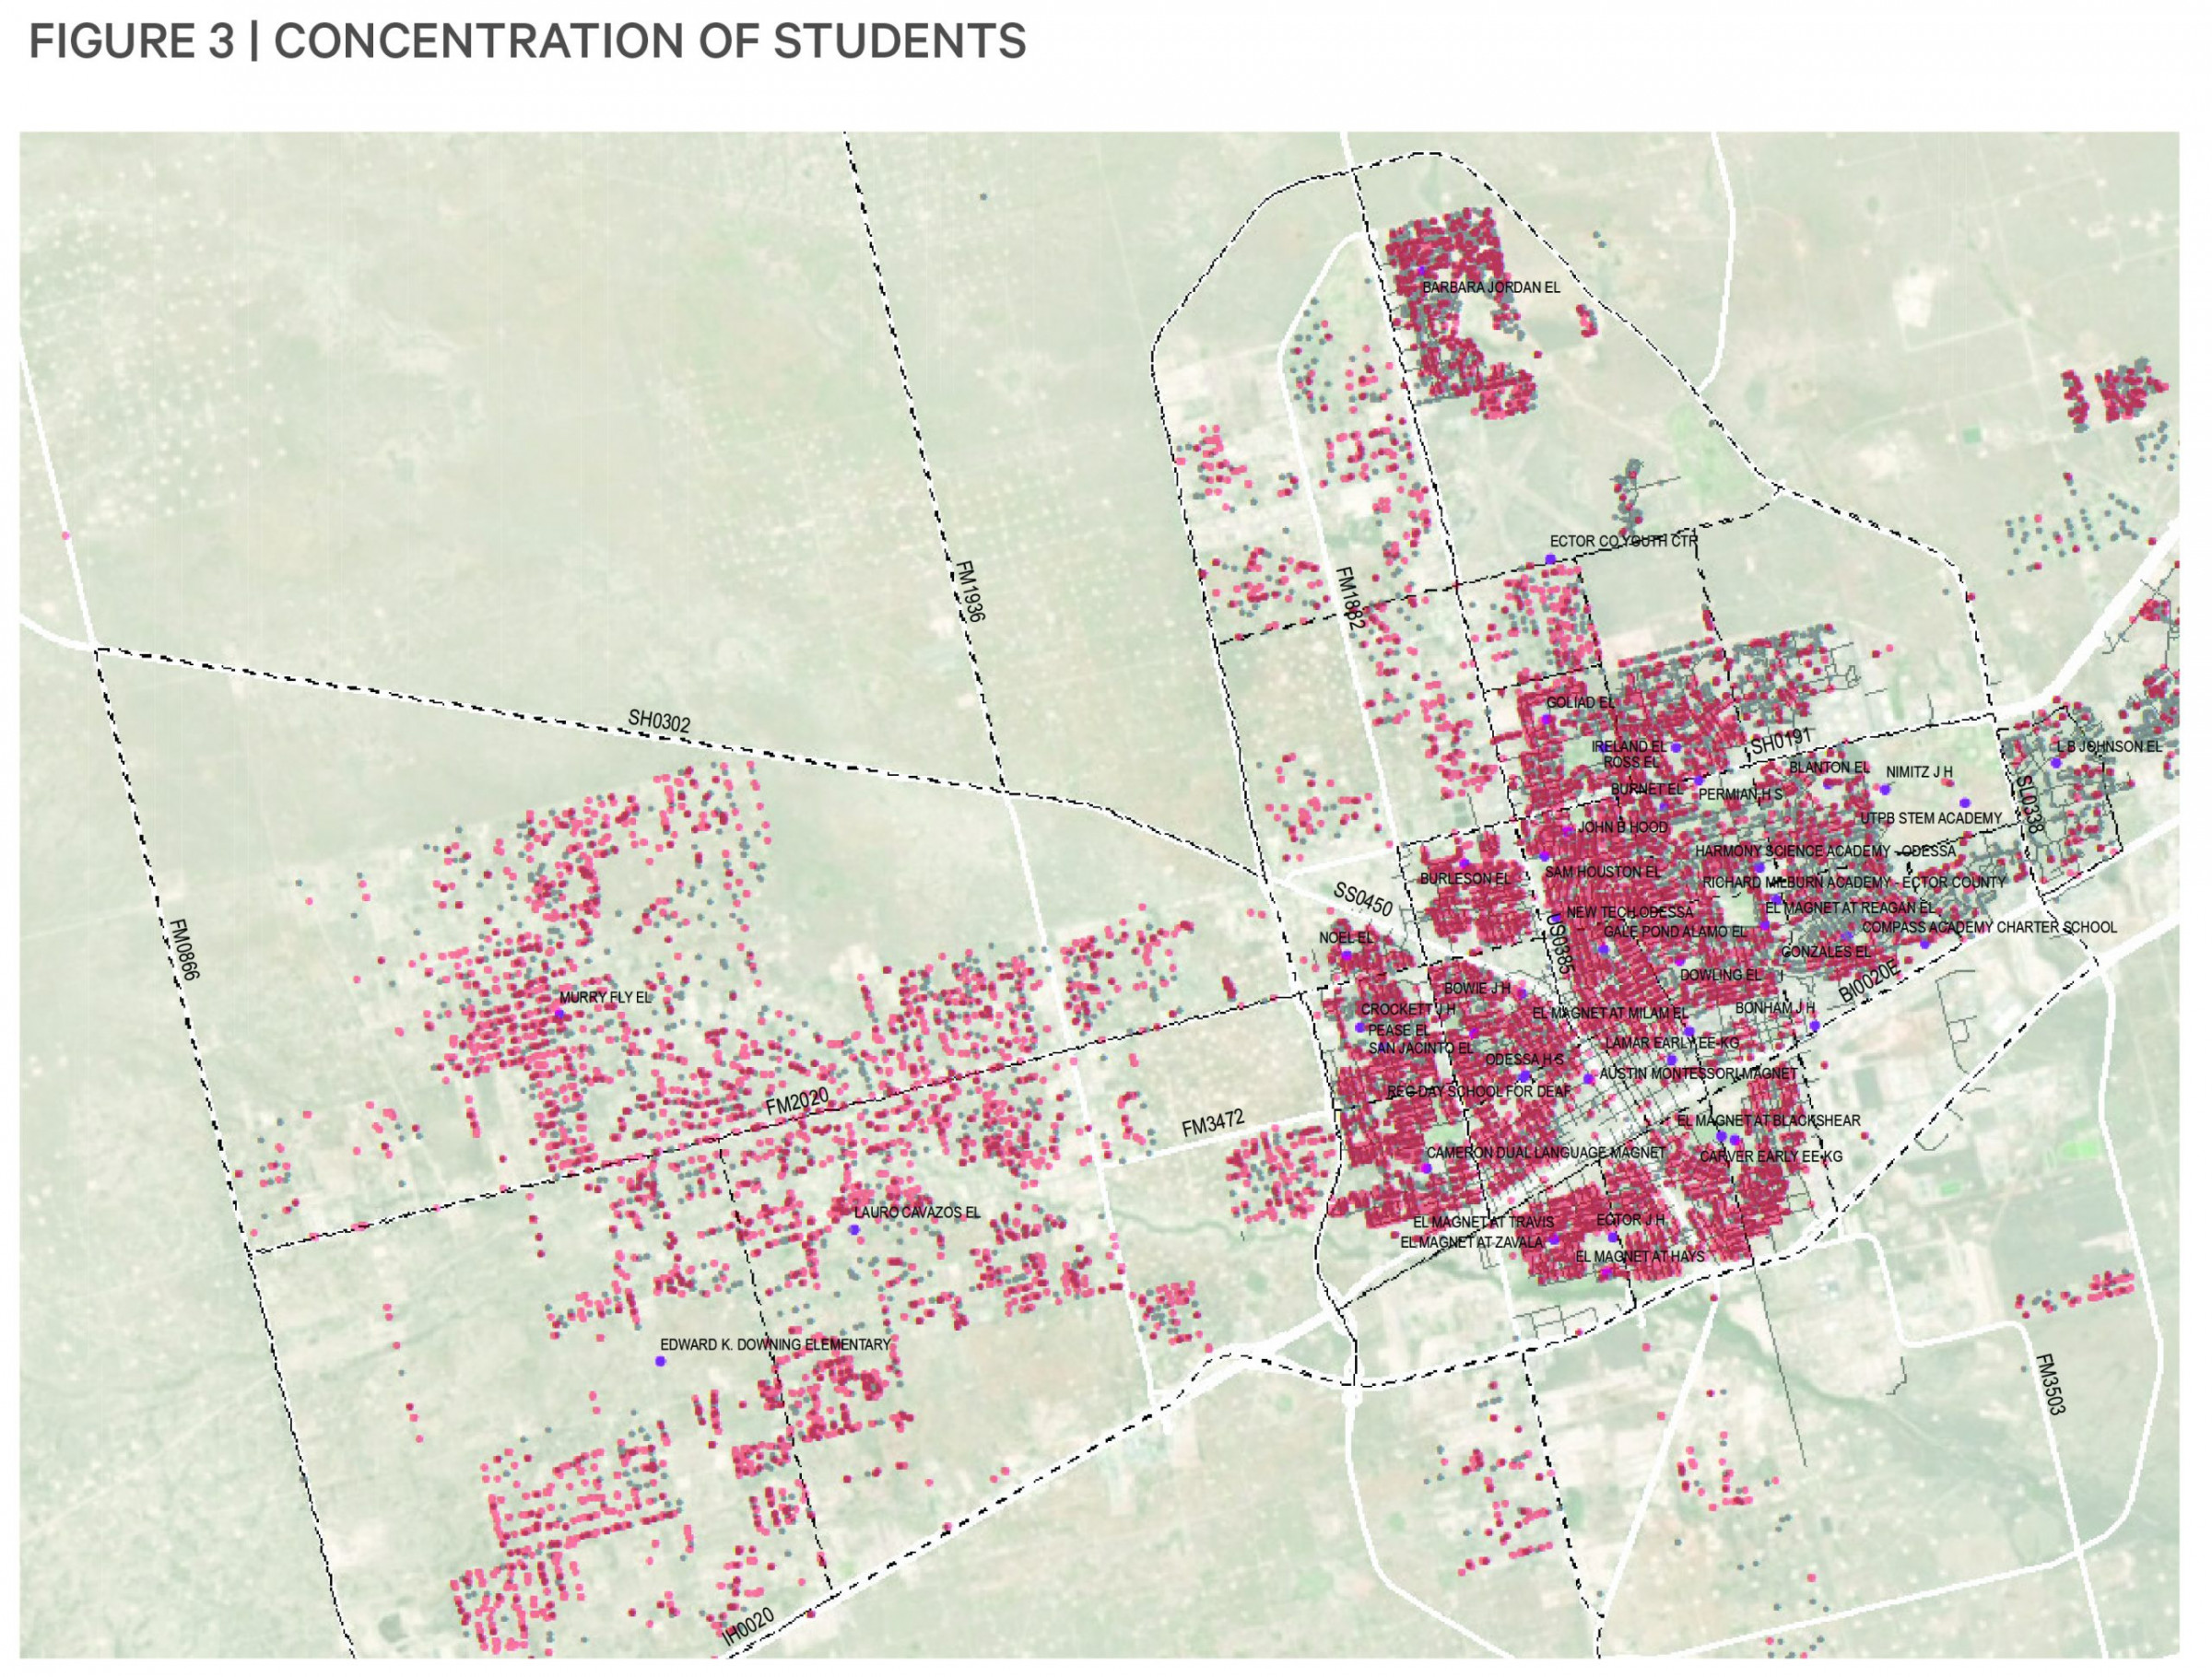
The Parkhill Analytics Team also looked at this distribution/correlation in terms of the actual geolocation of students. Figure 3 (zoomed in for clarity) shows ECODIS students in red and non-ECODIS students in grey dots. A darker red dot means there is more than one student in the same address/location. For a complete high-resolution map and the full analysis, go HERE.
FINDING THE MOST SUITABLE LOCATIONS FOR WIFI TOWERS
The Parkhill Analytics Team took upon this analysis to ask a question: How could this distribution of Economically Disadvantaged populations be of practical use when defining future WIFI infrastructure?
While this potential identification of most suitable sites for WIFI towers is still in progress and will likely result in modified outcomes, this article aims to describe the practical use of this analysis. The result shown herein is a first approximation of the potential of using the data available in Ector County.
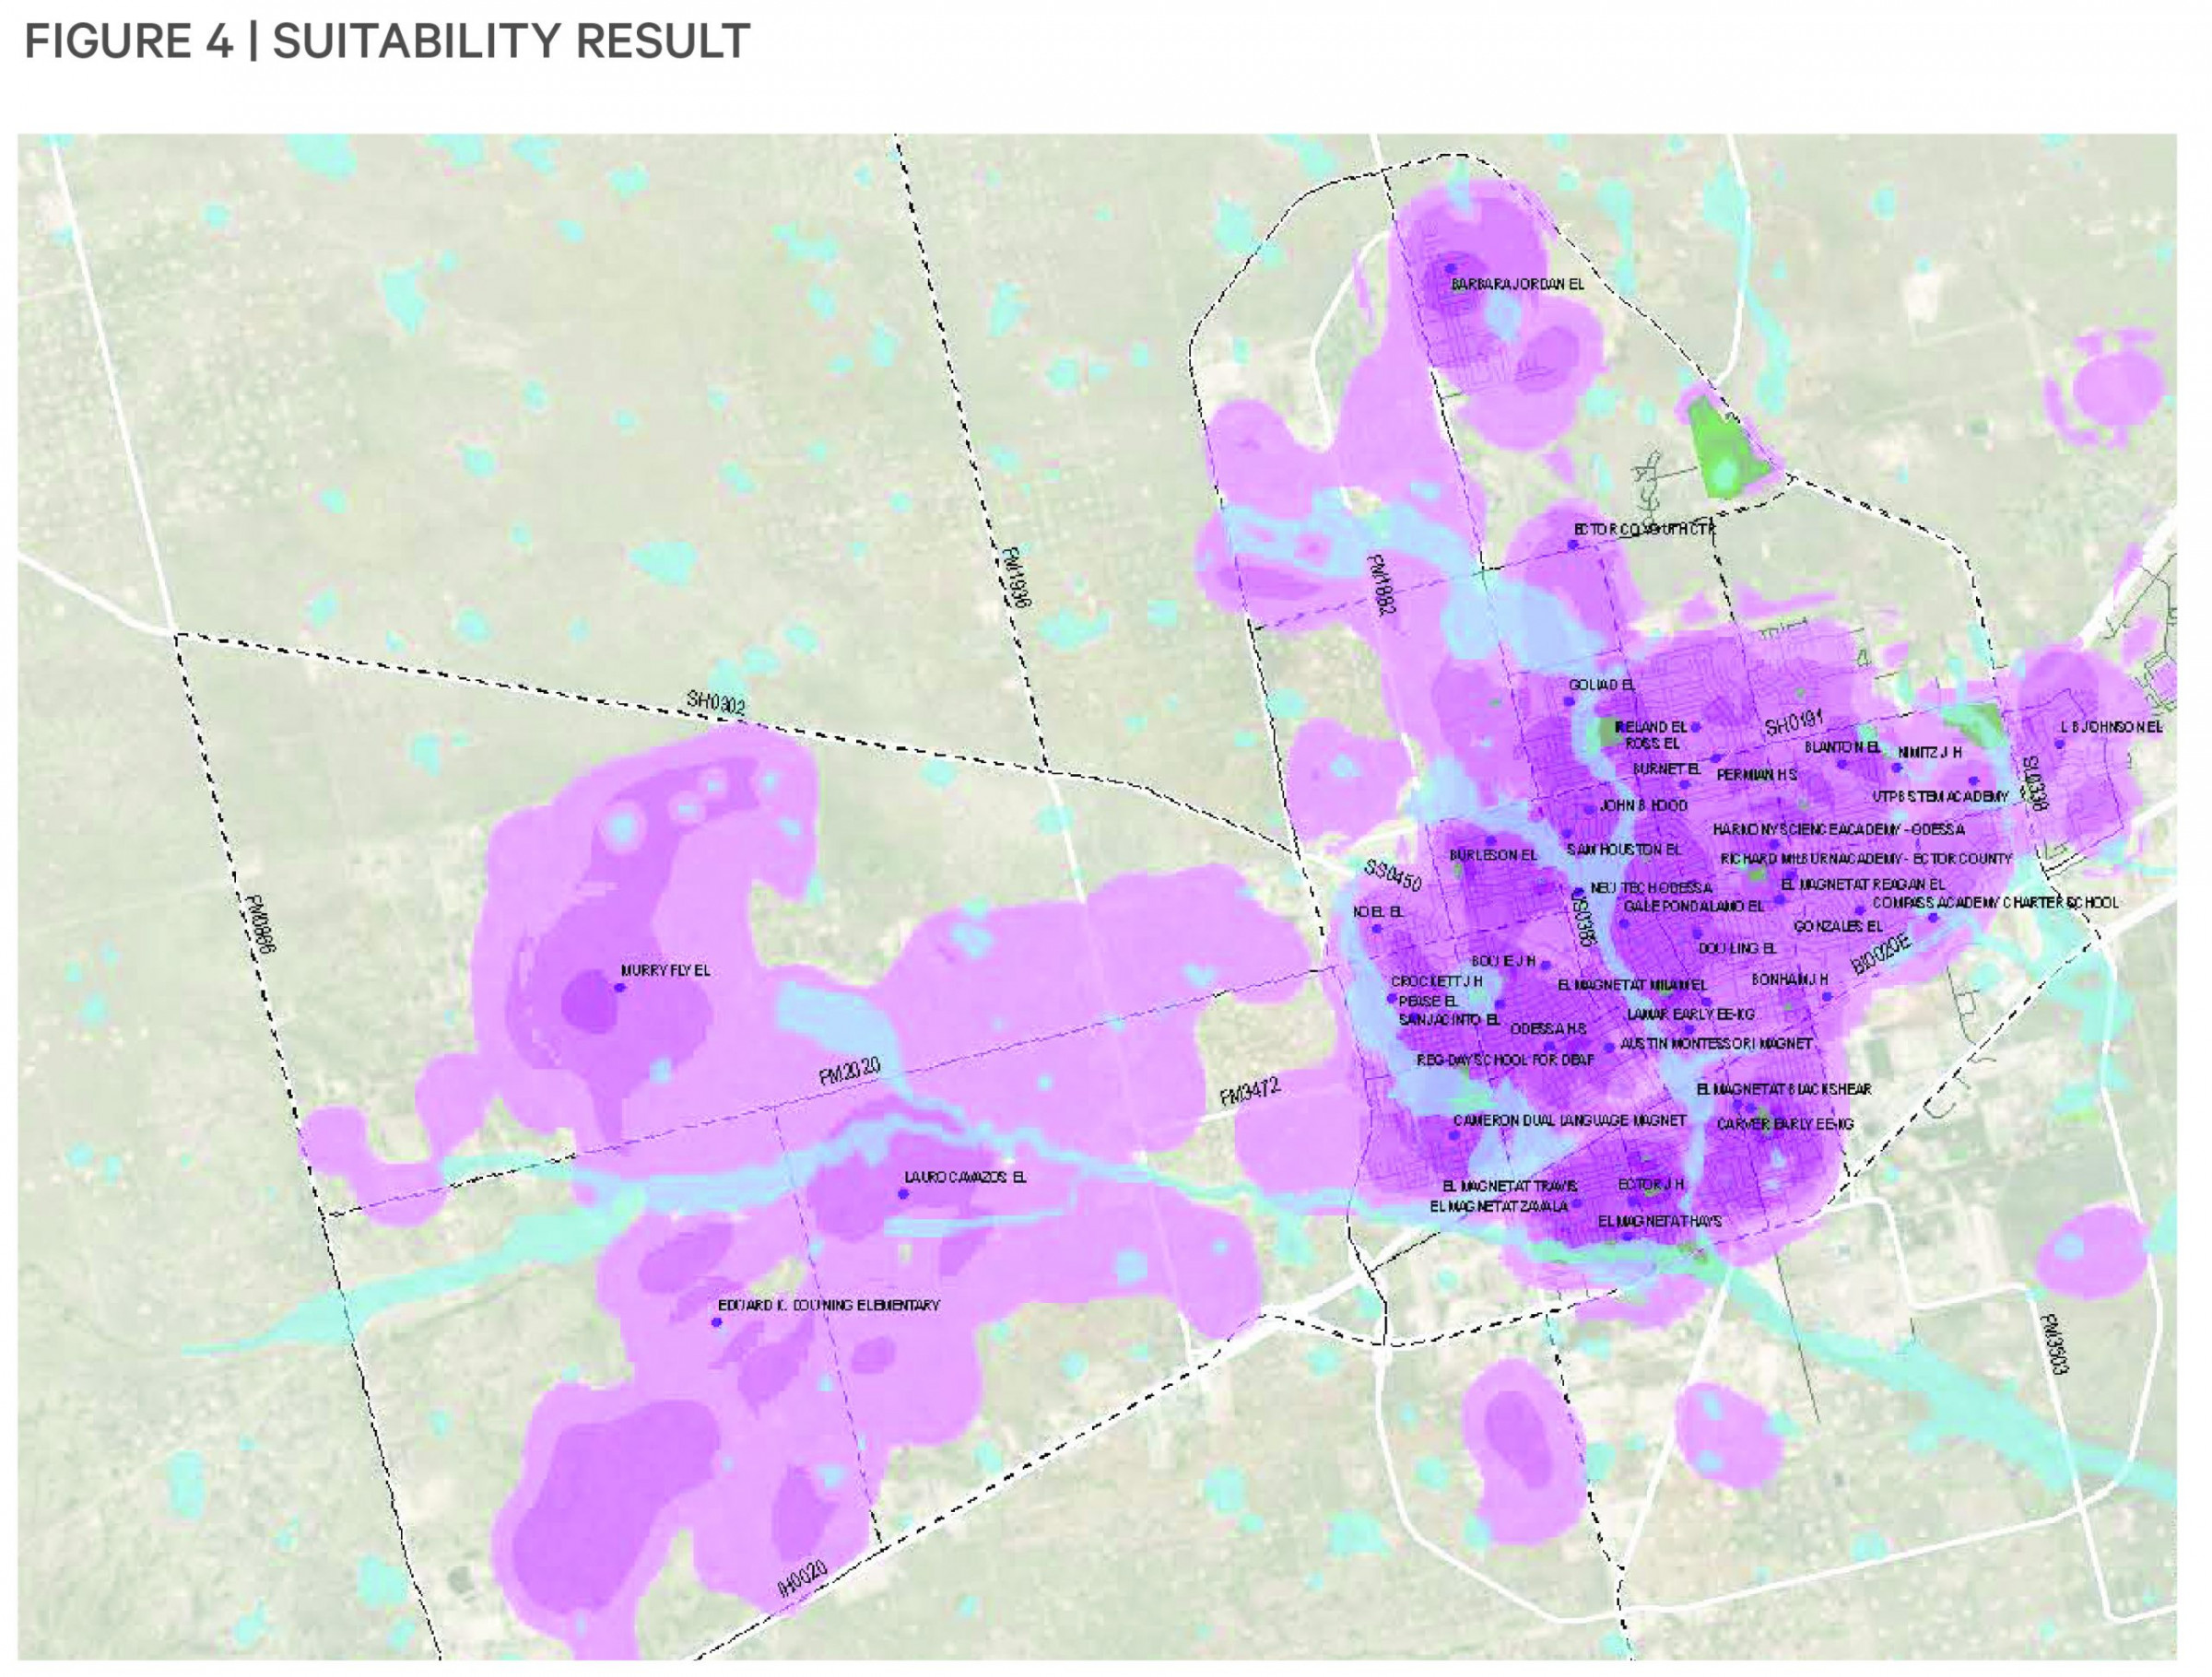 This result is the outcome of data operations after overlaying diverse layers related to the geography and socio-economic aspects of the City of Odessa (Ector County). Figure 4 shows darker purple areas where the location of WIFI Towers is more suitable; in pink, the less suitable.
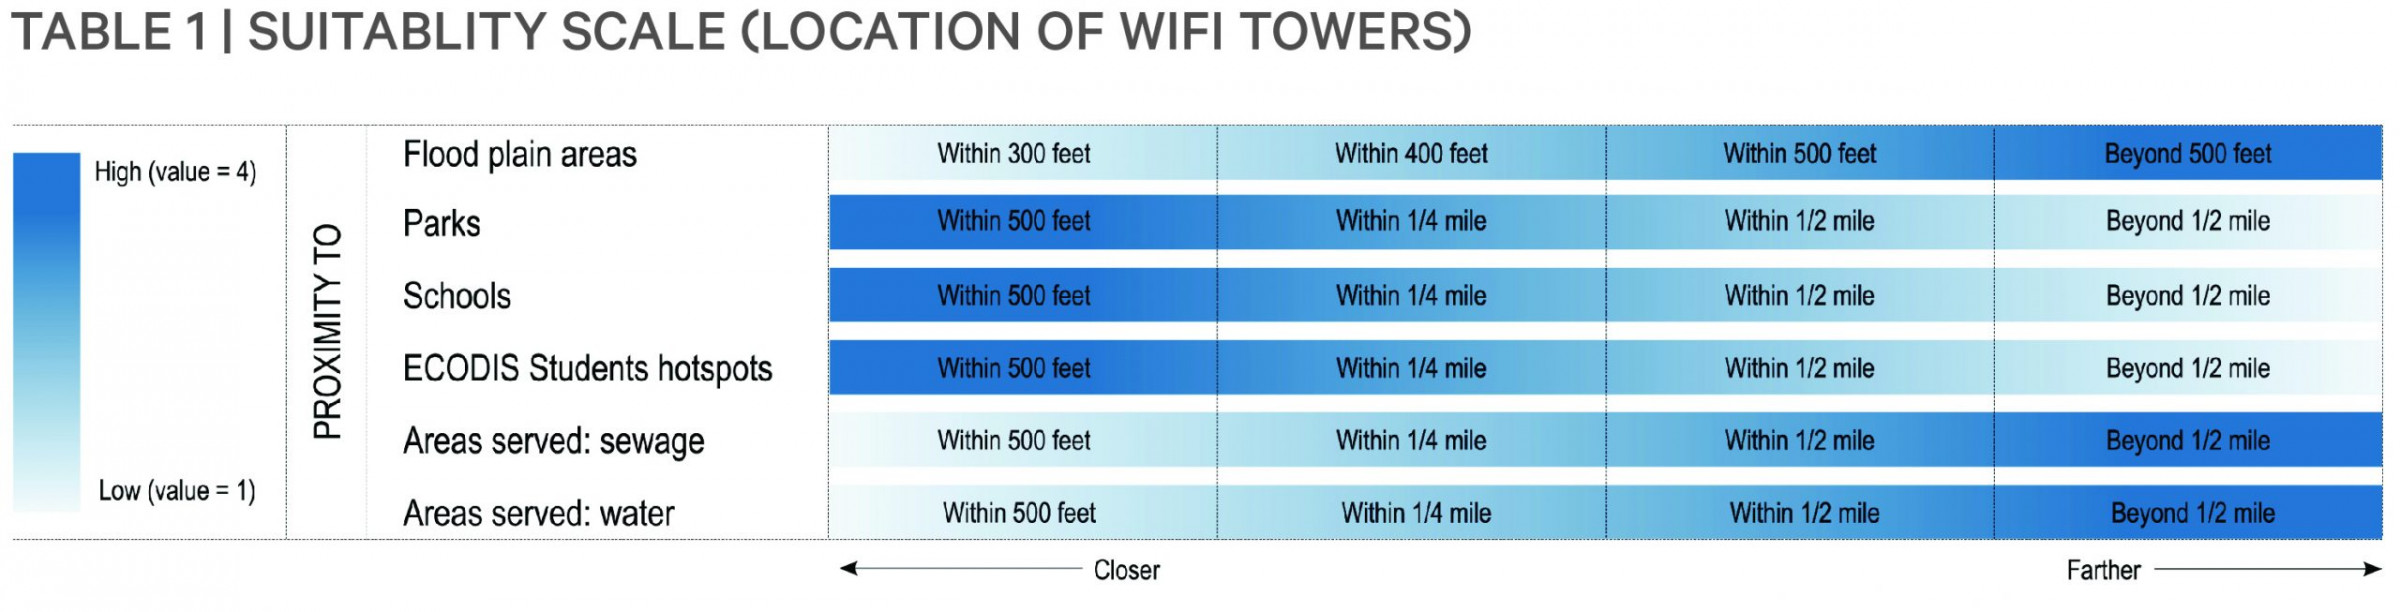
This suitability scale is based on a mix of heatmaps (figure 5 and table 1) for each layer/heatmap in the analysis. Once these six heatmaps were produced, these were overlaid with a set priority or “weight”:
Poverty concentration (ECODIS student hotspots) – 36%
Areas underserved by sewage – ~7%
Areas underserved by water – ~6%
Areas close to flood hazards – ~ 5%
Areas close to parks – ~23%
Areas close to schools – ~23%
The percentages listed above represent the weight/priority in this first draft for the analysis. The study is based on physical proximity to the items shown in table 1.

NEXT STEPS FOR ECTOR COUNTY ISD
Parkhill will strongly encourage ECISD to continue to develop the partnership with the Analytics Team to help the county plan ahead for the provision of infrastructure and technology. The Analytics Team will continue to help identify areas of high opportunity for the provision of WIFI Towers. These areas identified are primarily picked based on the lack of service in specific sections of the county, as well as the high concentration of ECODIS students. Parkhill could support not only the school district but the Planning Teams of the county and City of Odessa in their decision-making processes while supporting our joint mission of Building Community.
While this type of technology and infrastructure is an innovative way of proposing improvement, it might not be the most economically viable form of implementation. Parkhill is proud to support Ector County’s mission and to find additional and alternate solutions for these problems that are part of the daily concern of the School District, as well as issues that arise in specific circumstances like in this specific case with COVID-19.

Julio Carrillo, AICP, LEED AP ND is a Senior Planning and Manager. Julio joined Parkhill in March 2020 and brings more than 16 years of expertise in diverse areas with a strong focus on sustainability and architecture. As a Certified Planner, he has worked in various large-scale masterplans for mixed-use communities with a sustainable approach. Julio is originally from Peru and grew up in one of the most contaminated cities in the world: La Oroya. Throughout his career, he has been instrumental in supporting sustainable practices in planning and urban design in all his projects' interventions.